2020 Patent Activity in USPTO Art Unit 1600*
October-December | July-September | April-June | January-March
Below are assessments of US patent activity throughout calendar year 2020. Below are charts providing year-over-year comparisons of patents granted on a monthly basis in each of the past four calendar years – with a fifth column for the average across time periods. As we continue through the COVID-19 health and economic crisis, we at Mintz are interested to know the impact of the virus on activity at the USPTO, and are first looking at grant activity. We will be reviewing and providing thoughts on filings in the Life Sciences space during this period over time as well.
| Total Granted Patents - CALENDAR YEAR 2020 | |
|---|---|
| 2017 | 20,584 |
| 2018 | 19,994 |
| 2019 | 19,483 |
| 2020 | 18,937 |
4th Quarter Assessment (October-December)
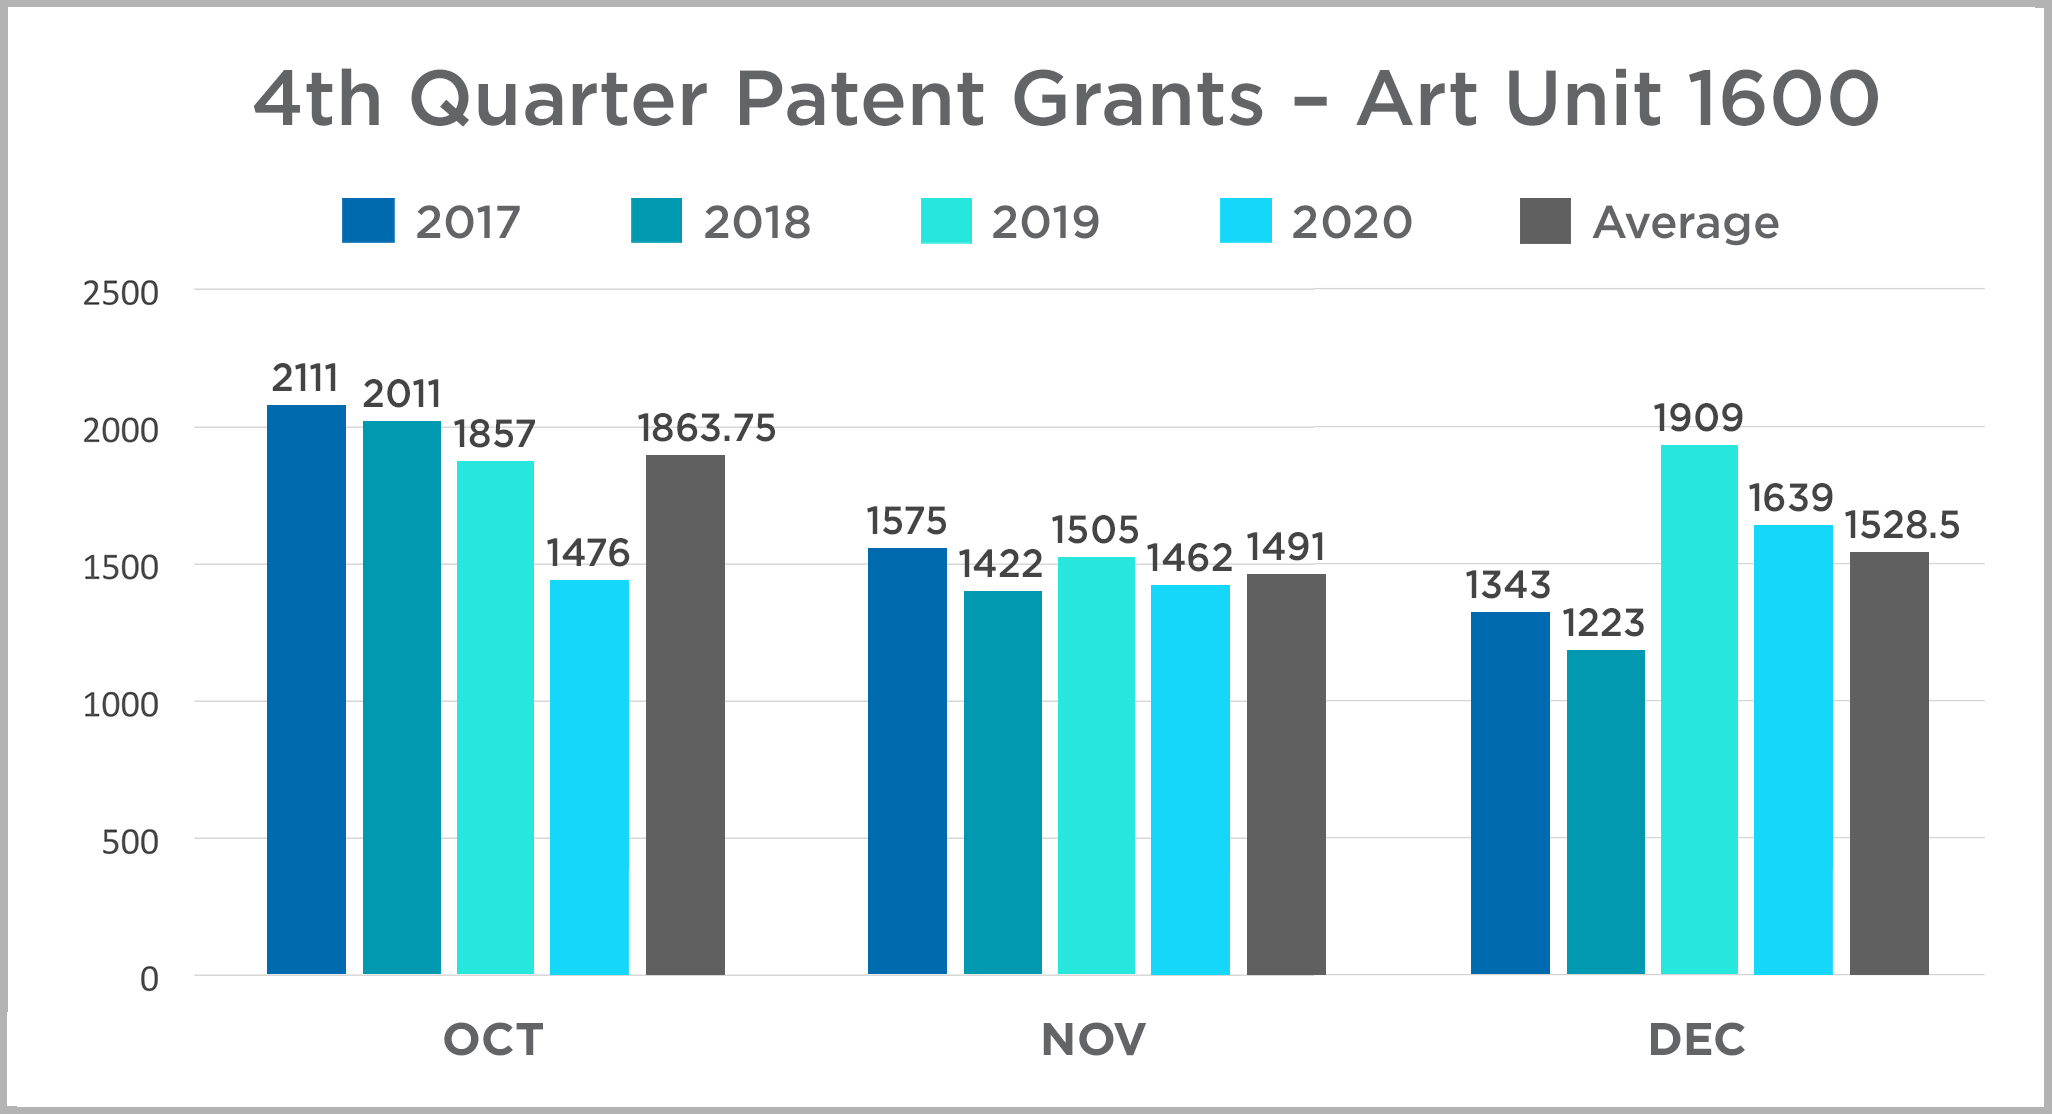
Patent Grants for the 4th quarter of 2020 lag behind the first three quarters of the year as well as the 4th quarter for the prior three years.
Throughout the last two quarters of 2020, patent grants are down from the prior year and are measurably below annual totals for 2019 and 2018.
While both 2020 and 2019 had the highest number of 4th quarter patent issuances occur in December, grant issuances in December 2020 were significantly lower than the previous year. Overall, the 4th quarter of 2020 saw the lowest number of total patent grants than any other quarter of the year.

3rd Quarter Assessment (July-September)
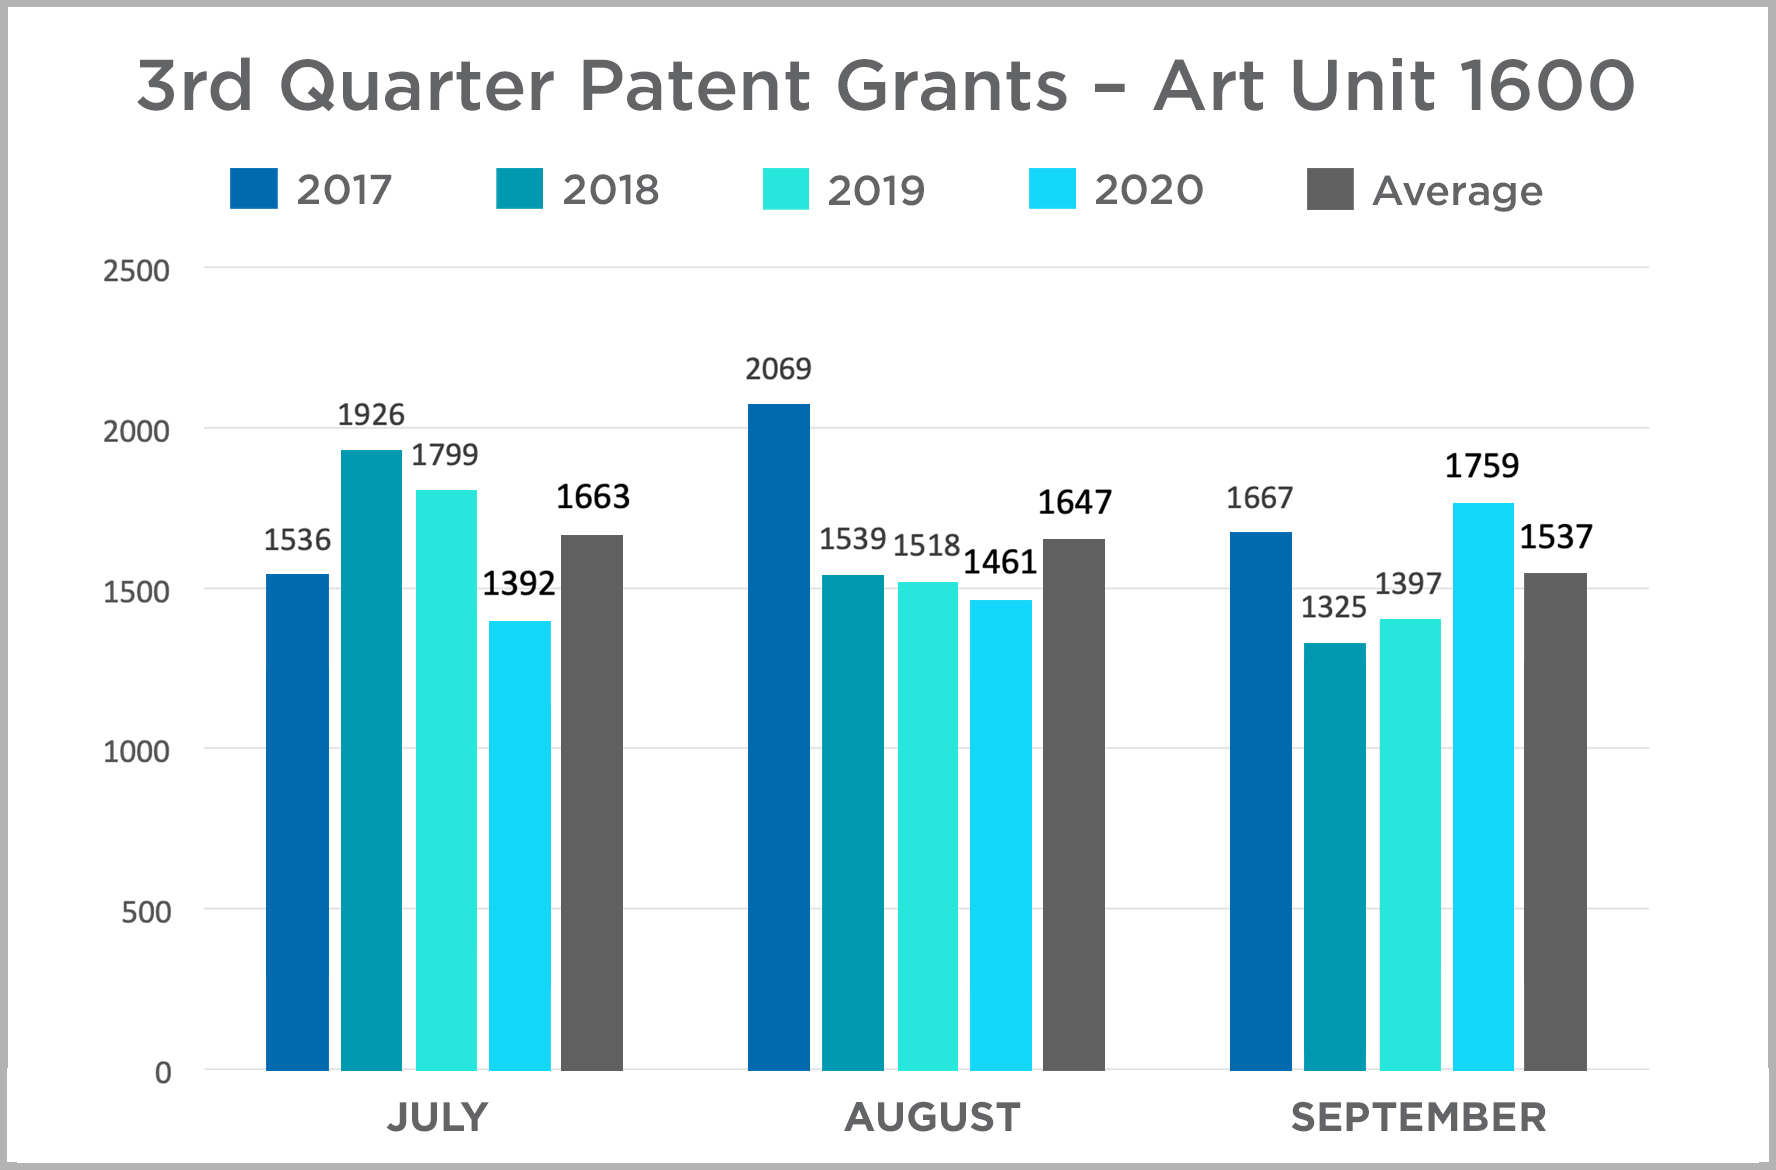
Patent Grants for the 3rd quarter of 2020 lag behind the first two quarters of the year as well as the 3rd quarter for the prior three years.
Through the first three quarters of 2020, patent grants are up from the prior year a small amount and are measurably below three-quarter totals for 2018 and 2017.
September was a good month for grants as compared to prior years, but was preceded by two months of below-average activity. July was a particularly slow month, falling well below average and individual amounts for each prior year. While August was also below average, it does not lag the past two years significantly. August 2017 causes the overall monthly average to be high.
July-September

1st Half Assessment (January-July)
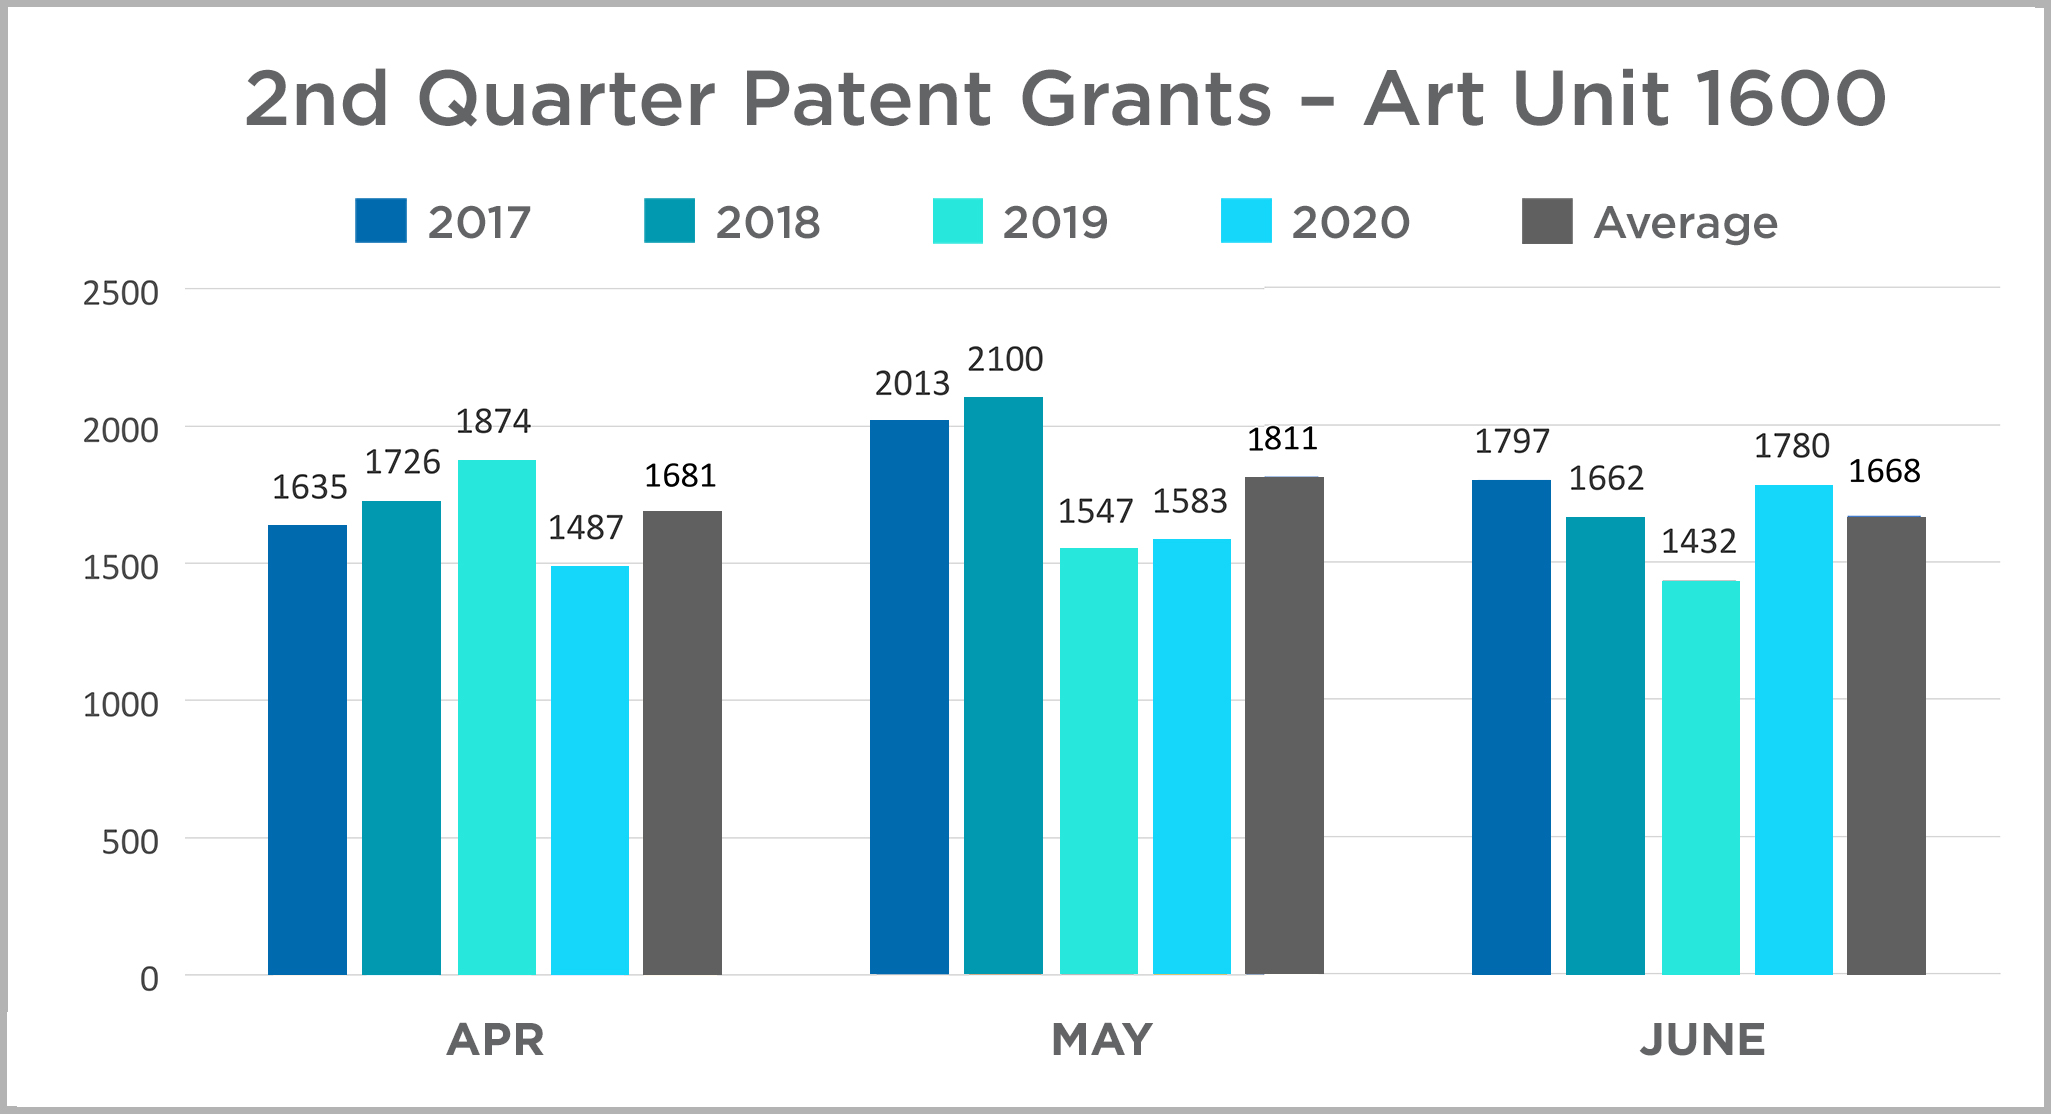
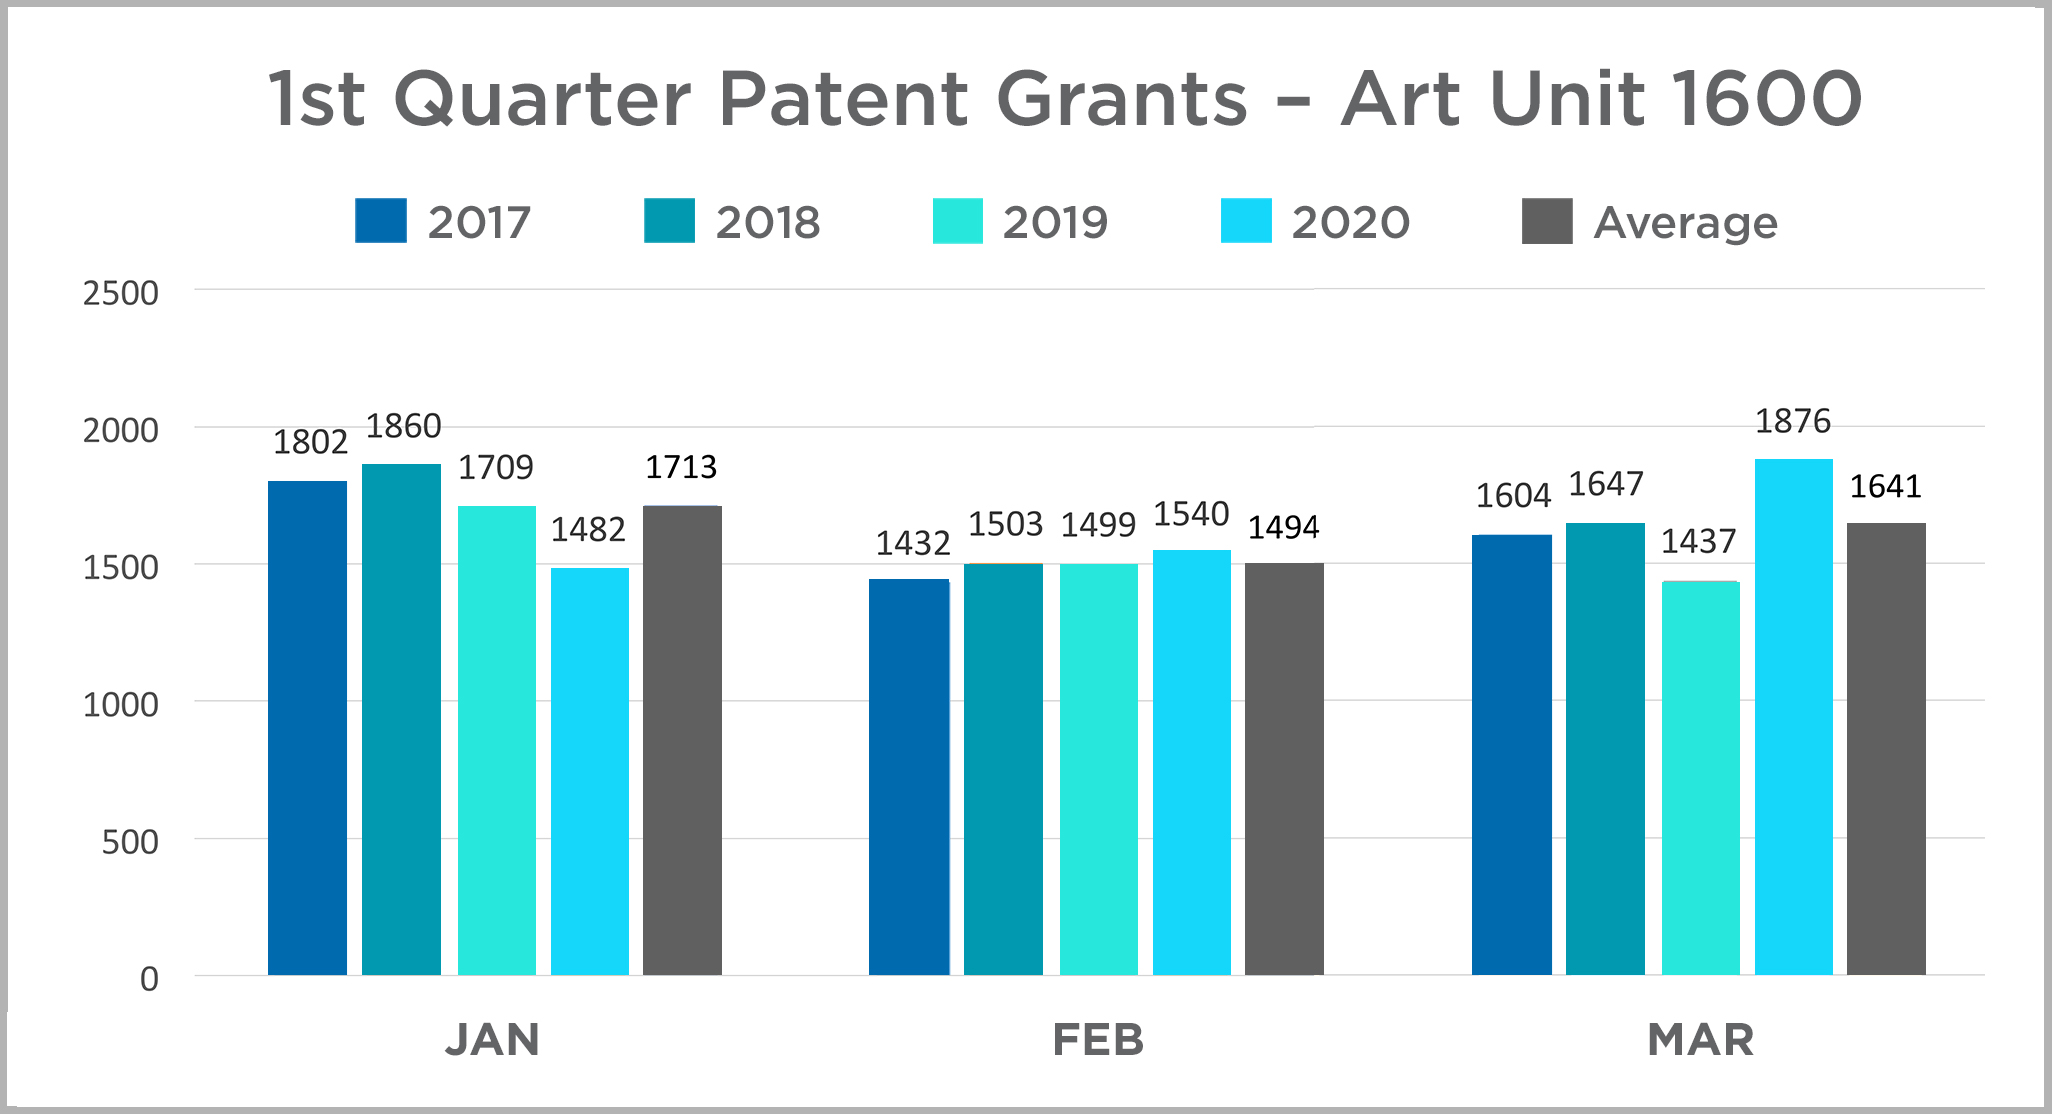
It is interesting to note that the average total for filings across the first half of this calendar year is higher than last year, but 2019 had a relatively low grant total, and we still see 2020 lagging behind 2017 and 2018 – and behind the average for total grants in the first half year during this time frame.
Grants were significantly up in March and then experienced an unusual drop into April, nearly as statistically unusual as the increase in March. What is certain is that activity in Art Unit 1600 is abundant, and while not on pace to set a record in calendar year 2020, not measurably anemic at this point either.
| Total Granted Patents - 1st & 2nd Quarters | |
|---|---|
| 2017 | 10,283 |
| 2018 | 10,498 |
| 2019 | 9,498 |
| 2020 | 9,748 |
April-June

January-March

